In Malaysia, the three household groups classified are B40, M40, and T20. B40 refers to the Bottom 40%, which is the lowest household income group. M40 refers to Middle 40% (middle income group), while T20 refers to Top 20% (highest income group).
40% of the Malaysian population belongs to the B40 group, and 40% belong to the M40 group, while the other 20% belong to the T20 group.
The average monthly income for the household is RM4,850 and below for B40, RM4,850 to RM10,959 for M40, and RM10,960 and above for T20.
Based on the Household Income and Basic Amenities Survey Report 2019 by the Department of Statistics Malaysia released recently, the B40, M40 and T20 household groups are now classified into 10 categories.
According to Chief Statistician Datuk Seri Dr Mohd Uzir Mahidin in a BERNAMA report, the B40 group can be classified into B1, B2, B3 and B4; group M40 to M1, M2, M3 and M4 while group T20 to T1 and T2.
Here are the 10 new categories classified:
| Household Group | Category | Household Income |
|---|---|---|
| B40 | B1 | Below RM2,500 |
| B2 | RM2,501 – RM3,169 | |
| B3 | RM3,170 – RM3,969 | |
| B4 | RM3,970 – RM4,849 | |
| M40 | M1 | RM4,850 – RM5,879 |
| M2 | RM5,880 – RM7,099 | |
| M3 | RM7,100 – RM8,699 | |
| M4 | RM8,700 – RM10,959 | |
| T20 | T1 | RM10,960 – RM15,039 |
| T2 | RM15,040 and above |
According to the Chief Statistician, this classification will allow for more targeted planning, monitoring and programs to be implemented to reduce the income gap between households in a bid to achieve a high-income country status.
Summary of Malaysian household income for 2019
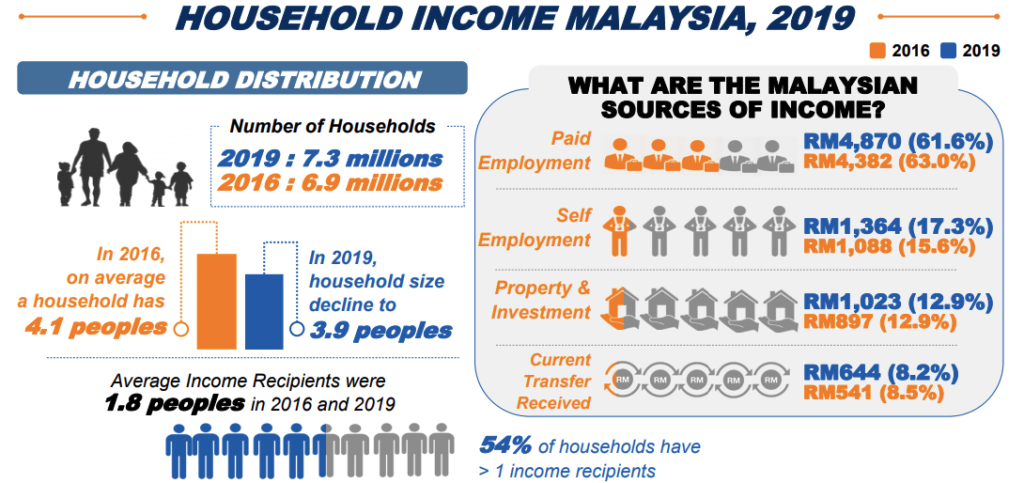
The survey shows that the B40 group in 2019 consists of 2.91 million households, M40 about 2.91 million households, and 1.46 million households are in the T20 group. The survey involved 7.3 million Malaysian households.
In 2016, the average household was 4.1 people. In 2019, household size has decreased to 3.9 people. About 54% of households have more than one income recipient. The four main sources of income for Malaysians are paid employment, self-employment, property and investment, as well as current transfers.
The average household income in rural areas rose higher than the national level at 4.6%. The survey also found that the average household income gap between Rural and Urban is RM3,631.
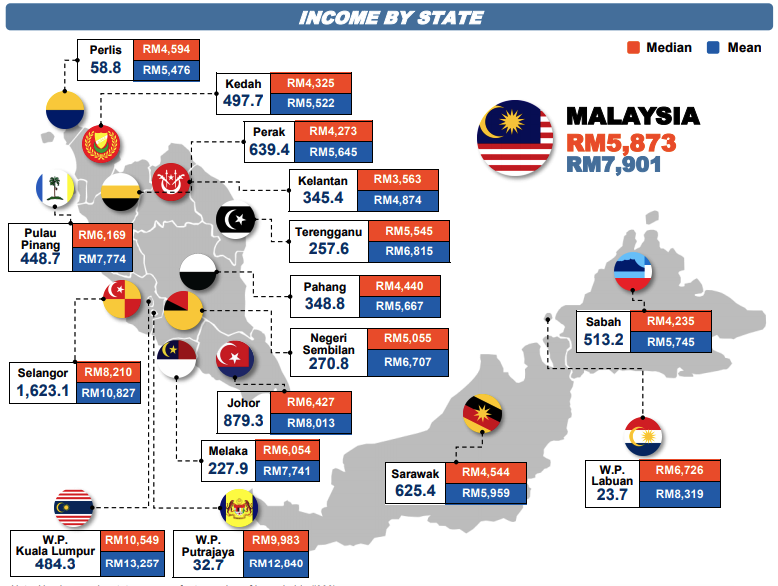
Here is the income by state (sorted from highest median to lowest median):
| State | Median | Average |
|---|---|---|
| Kuala Lumpur | RM10,549 | RM13,257 |
| Putrajaya | RM9,983 | RM12,840 |
| Selangor | RM8,210 | RM10,827 |
| Labuan | RM6,726 | RM8,319 |
| Johor | RM6,427 | RM8,013 |
| Penang | RM6,169 | RM7,774 |
| Melaka | RM6,054 | RM7,741 |
| Terengganu | RM5,545 | RM6,815 |
| Negeri Sembilan | RM5,055 | RM6,707 |
| Perlis | RM4,594 | RM5,476 |
| Sarawak | RM4,544 | RM5,959 |
| Pahang | RM4,440 | RM5,667 |
| Kedah | RM4,325 | RM5,522 |
| Perak | RM4,273 | RM5,645 |
| Sabah | RM4,235 | RM5,745 |
| Kelantan | RM3,563 | RM4,874 |
The three districts with the highest median and average incomes are Petaling, Sepang, and Gombak. For Petaling, the median income is RM8,993 while the average income is RM12,145. Sepang recorded a median income of RM8,937 while the average income was RM12,254. Gombak recorded a median income of RM8,501 with an average income of RM11,536.
The three districts with the lowest median and average incomes are Pitas, Tongod, and Kota Marudu. For Pitas, the median income is RM1,999 while the average income is RM3,378. Tongod recorded a median income of RM2,197 while the average income was RM3,364. Kota Marudu recorded a median income of RM2,425.
Source of income
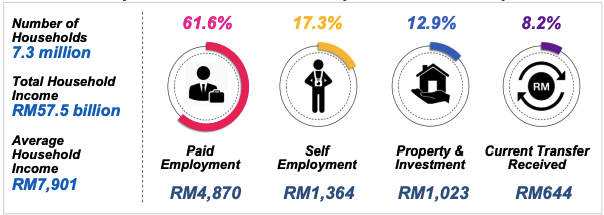
Based on the survey findings, income from paid employment is the main source of income with 61.6% of total household income, followed by income from self employment (17.3%) and income from property & investment (12.9%). Meanwhile, current transfer received accounted 8.2% of total household income in Malaysia.
Ownership of basic facilities in Malaysia
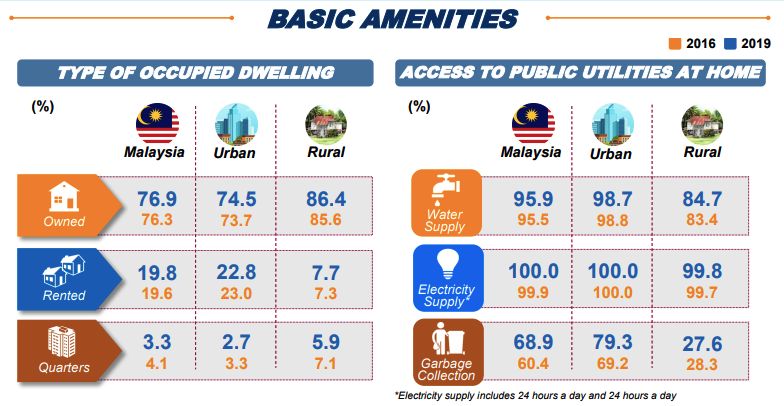
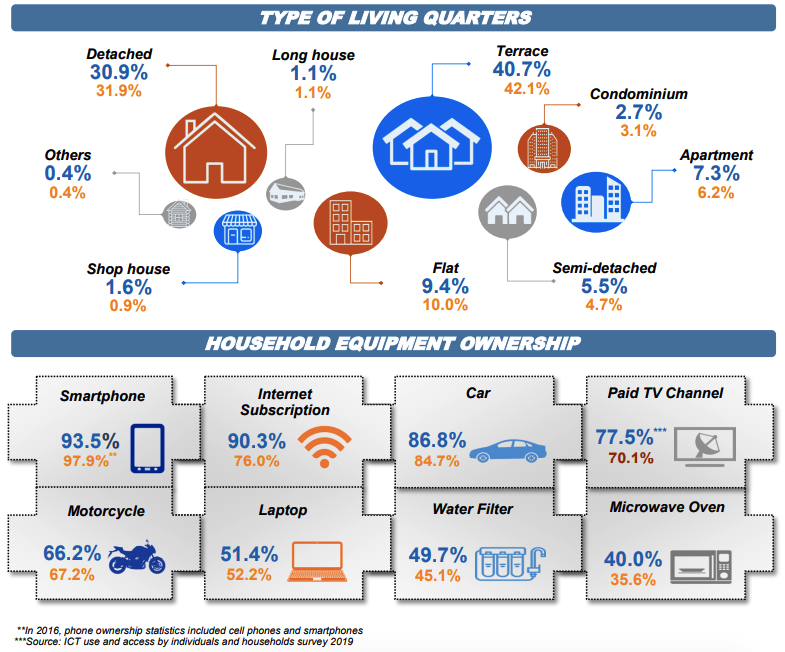
For home ownership, 76.9% of Malaysians own a house in 2019, while 19.8% are renting. A total of 3.3% live in the quarters. About 40.7% of Malaysians live in terraced houses, 30.9% live in single houses, 9.4% live in flats, 7.3% live in apartments, 5.5% live in semi-detached houses, 2.7% live in condominiums, 1.6% live in shophouses, and 1.1% live in longhouses.
For household appliances, the three things with the most ownership are smartphones, home Internet subscriptions, and cars. A total of 93.5% of Malaysians own a smartphone, 90.3% subscribe to the Internet, and 86.8% own a car. For public utility access at home, 95.9% of Malaysians have access to piped water supply. 100% have access to electricity, while only 68.9% have access to garbage collection services.
Household Income and Inflation
Based on the survey findings, it is found that the household income has grown faster than inflation rate over the years. On average, the price of goods and services have increased by 23.6% over the past 10 years, between 2009 and 2019. At the same time, household income also increased by 2.0 times.
The increase in income can also be seen from the perspective of household group. Since 2002, the B40, M40 and T20 household groups have shown higher income growth than inflation rate. The increase in income will indirectly increase the purchasing power of households.


